
Vehicle crime in Dulwich Village ward hit 22 in August, its highest in 14 months, while Peckham Rye fell from 33 to 8. Street figures and a ward table.
Police recorded 22 vehicle crimes in Dulwich Village ward in August 2026. That is the ward’s highest monthly figure in the 14 months we checked. In the 13 months before, it averaged 11.5 a month.
Peckham Rye ward went the other way. Its July figure of 33, which we reported last month, fell back to 8 in August. That is within the ward’s usual range of 2 to 11 a month.
The figures come from the police.uk street-level crime data, published about two months in arrears. August 2026 is the latest month available. We counted every crime inside the Metropolitan Police’s own boundary for each ward, the same method as our July analysis.
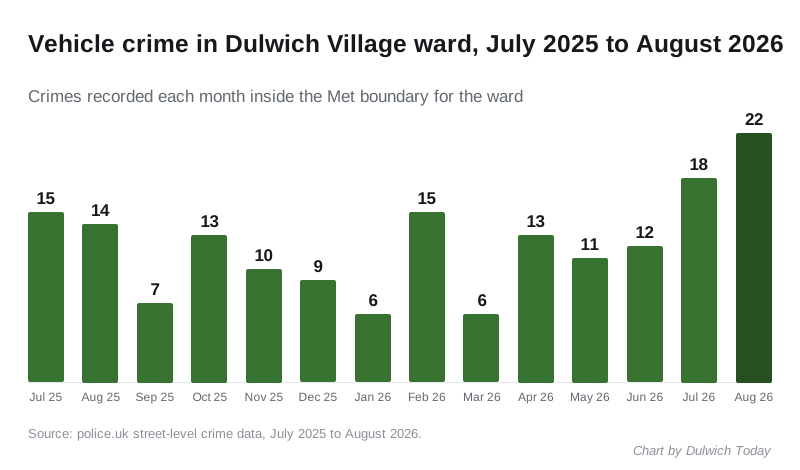
July’s spike did not last
Across the 11 wards that make up Dulwich, Peckham and Camberwell, vehicle crime fell from 195 in July to 122 in August. July was the highest month in the period by a distance. August is back in line with the rest of 2026, though it is still above the 109 recorded in August 2025.
| Ward | August 2025 | July 2026 | August 2026 |
|---|---|---|---|
| Dulwich Village | 14 | 18 | 22 |
| Goose Green | 15 | 18 | 14 |
| Dulwich Wood | 5 | 19 | 12 |
| Peckham | 10 | 25 | 12 |
| Camberwell Green | 7 | 11 | 11 |
| Rye Lane | 19 | 19 | 11 |
| St Giles | 11 | 7 | 11 |
| Dulwich Hill | 10 | 18 | 10 |
| Nunhead and Queen’s Road | 9 | 22 | 8 |
| Peckham Rye | 4 | 33 | 8 |
| Champion Hill | 5 | 5 | 3 |
| All 11 wards | 109 | 195 | 122 |
Only two wards rose between July and August: Dulwich Village, and St Giles, from 7 to 11. Nunhead and Queen’s Road fell from 22 to 8, and Peckham from 25 to 12.
Where the August cases were
Police.uk places each crime “on or near” a street or landmark rather than at an exact address. The 22 Dulwich Village cases were spread across 17 locations. The ones with more than one were:
- Holmdene Avenue: 3
- Dovercourt Road: 2
- Wyneham Road: 2
- near a further or higher education building: 2
The other 13 cases were one each, on roads including Court Lane Gardens, Woodwarde Road, Druce Road, Ardbeg Road, Beauval Road and Elfindale Road.
Twenty of the 22 are listed with the outcome “Investigation complete; no suspect identified”. The other two are still under investigation.
In Peckham Rye ward, Waveney Avenue again had the most cases, with 2 of the 8. It had 6 in July.
Vehicle crime in police.uk covers theft of a vehicle, theft from a vehicle and interference with one. The data does not say which of the three each case was.
Other crime in August
Comparing August 2026 with August 2025 across the 11 wards, most categories rose. The biggest changes were:
| Type | August 2025 | August 2026 |
|---|---|---|
| Shoplifting | 105 | 146 |
| Theft from the person | 74 | 114 |
| Bicycle theft | 29 | 48 |
| Violence and sexual offences | 345 | 375 |
| Burglary | 74 | 83 |
| Robbery | 38 | 45 |
Theft from the person covers pickpocketing and snatch thefts, including phone snatches. In total, crime and anti-social behaviour rose from 1,364 reports to 1,528, an increase of 12%.
One category is left out of that total. Criminal damage and arson in the 11 wards ran at 54 to 82 a month until April 2026, then dropped to between 3 and 7 a month from May. The same drop shows across other London boroughs in the Met’s data, and police.uk has published no explanation. It looks like a gap in what the Met has supplied rather than a real fall in vandalism, so we have excluded it from both years.
What it means for you
- If your car was broken into or tampered with, report it to the Met online or on 101, even if nothing was taken. These figures only count what was reported.
- Check your own street. Put your postcode into police.uk for a map of reported crime and the contact details for your ward’s Safer Neighbourhood Team.
- Keep the car empty, including charging cables, sat-nav mounts and bags left on seats.
- If you park on a residential street, our guide to parking in Dulwich covers controlled zones and permit rules.
How we did this: we downloaded every crime record for each month from July 2025 to August 2026 from the police.uk API, using the Met’s published boundary for each ward, and checked that every record carried the month requested. Our re-run of the earlier months matched the July figures we published in September exactly. The totals include anti-social behaviour, which police.uk publishes alongside crime. September’s data is due in late November.
Have your say