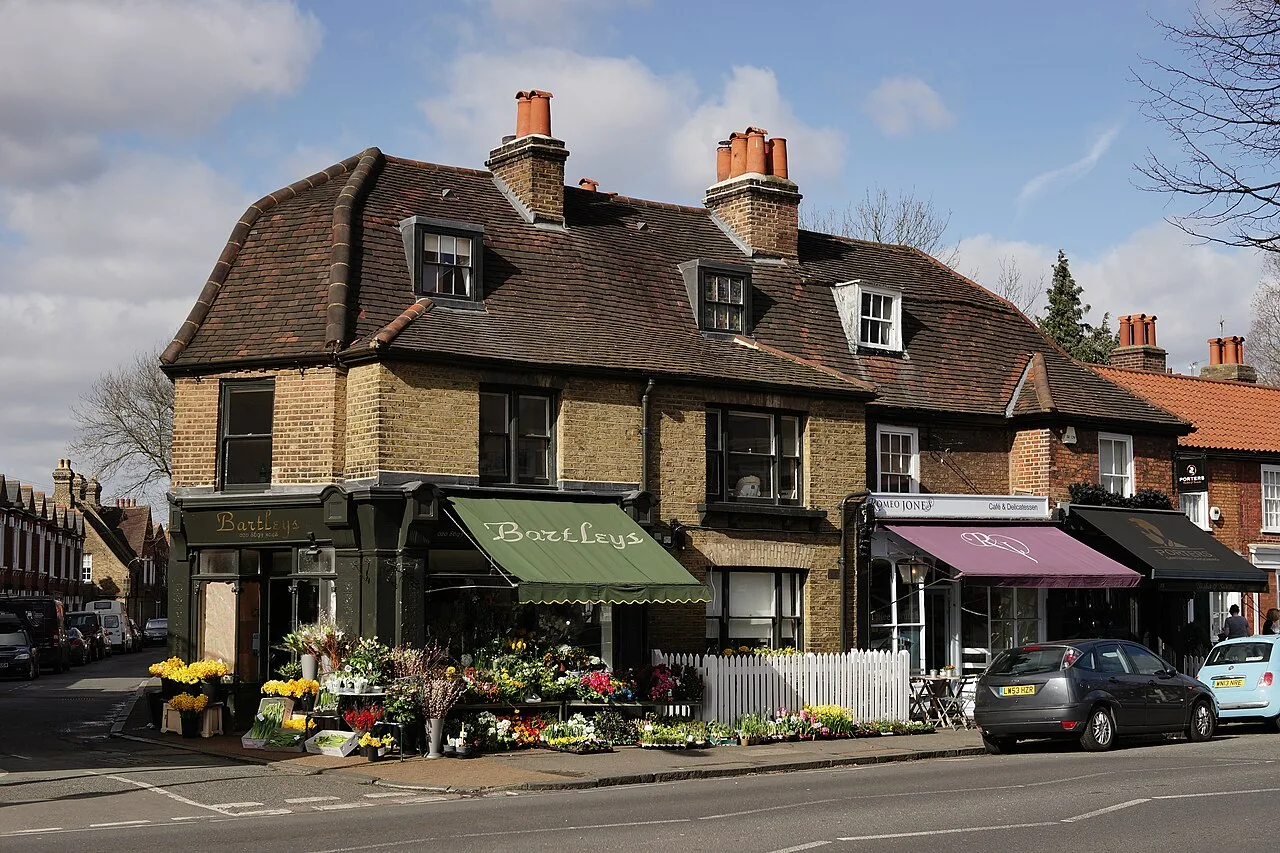

The middle SE21 sale was £1,370,000 and SE22 £710,000, against a £520,000 Southwark median. Area and street medians from 2,535 Land Registry sales, plus the borough index.
Asking prices are what sellers hope for. What counts is what homes actually change hands for, and every completed sale in England and Wales is recorded by HM Land Registry and published. This page reads those records for Southwark: the official borough average, and then the thing the borough average hides, which is that Dulwich Village and Camberwell are in the same council area and about £925,000 apart.
Two warnings before the numbers. First, the official index covers the whole Southwark borough, which runs five miles from the Thames at Bankside to the Crystal Palace ridge, and contains both £2 million houses off Dulwich Common and £300,000 flats off the Old Kent Road. The borough average describes neither. Second, Southwark is a flat market: 71% of everything sold here in the last year was a flat or maisonette. Any figure that mixes flats and houses is telling you about the mix as much as the money.
The headline figure
The average home in Southwark sold for £578,683 in May 2026, the most recent month published in the UK House Price Index. That is up 0.9% over the year.
That small rise is the interesting part, because London as a whole is falling. Over the same twelve months London fell 3.7% to £544,814 while England rose 2.3% to £292,095. Southwark went up. It is now £33,869 above the London average and £286,588 above the England average.
Set it against the borough’s own record and the picture is flatter. Southwark peaked at £612,818 in January 2021. Five years on the average is £34,135, or 5.6%, below that peak in cash terms, and much further below once inflation is allowed for. There was a second, lower peak of £596,645 in October 2025, followed by a dip through the winter and a recovery each month since March.
What it means for you
If you are buying, the softness is in flats and nowhere else. The average Southwark flat is unchanged over the year, 0.0%, while the average terraced house is up 3.8% and the average semi up 2.8%. The gap between a flat and a house is widening, not closing, which is the opposite of what a falling London market would lead you to expect.
If you are selling a flat, you are selling into the one part of this market that has not moved for a year, and there are a great many of you: flats were 1,799 of the 2,535 sales we counted. If you are selling a house, particularly a terrace in East Dulwich or Peckham, the index is on your side.
If you are staying put, your home is worth roughly 1% more than it was last spring and about 6% less than it was at the start of 2021.
Prices by property type
Borough averages for May 2026, from the UK House Price Index:
- Detached houses: £1,712,680, up 1.5% over the year. Rare enough here to be a curiosity: only 29 sold in the whole borough in a year.
- Semi-detached houses: £1,225,012, up 2.8%. The large Victorian pairs of Dulwich, Herne Hill and Camberwell Grove.
- Terraced houses: £845,316, up 3.8%. The fastest-rising type in the borough.
- Flats and maisonettes: £475,877, unchanged at 0.0%. Seven in ten sales.
The same data splits buyers rather than buildings. A first-time buyer in Southwark paid an average of £507,478 in May 2026, which is £215,383 more than the average price of any home in England.
What each part of the borough actually sells for
This is where the borough average stops being useful.
The table below is our own analysis of 2,535 residential sales recorded in the Southwark district that completed between 1 July 2025 and 30 June 2026, taken from HM Land Registry Price Paid data. It shows the median, the middle sale, which one enormous transaction cannot distort. The borough median over that period was £520,000; the mean over the same sales was £728,244, and the £208,000 gap between those two numbers is exactly why we use the median.
A note on the postcodes, because on this site it matters more than usual. Only SE17 and SE22 sit wholly inside Southwark. SE1, SE5, SE21 and SE24 are shared with Lambeth; SE15 and SE16 are shared with Lewisham. Only sales the Land Registry records in the Southwark district are counted below. That is why the SE21 row is small: it is the Southwark side of Dulwich, essentially Dulwich Village and Sydenham Hill, and not the West Dulwich streets over the Lambeth boundary.
| Outcode | Mainly | Median | Sales |
|---|---|---|---|
| SE21 | Dulwich Village and Sydenham Hill, Southwark side | £1,370,000 | 53 |
| SE24 | The Southwark side of Herne Hill | £1,017,500 | 42 |
| SE22 | East Dulwich and Peckham Rye | £710,000 | 384 |
| SE1 | Bankside, Borough, London Bridge and north Bermondsey | £550,000 | 565 |
| SE15 | Peckham and Nunhead | £520,000 | 525 |
| SE19 | The Southwark sliver of Crystal Palace | £466,000 | 43 |
| SE16 | Rotherhithe, Surrey Quays and Canada Water | £465,000 | 368 |
| SE17 | Walworth and Elephant and Castle | £453,750 | 206 |
| SE5 | Camberwell | £445,000 | 300 |
Dulwich on its own
SE21 and SE22 are two different markets that happen to share a name.
SE21, the Southwark side of Dulwich Village and Sydenham Hill, carried 53 sales at a median of £1,370,000. That is £850,000 above the borough median and the highest of any postcode district here by a distance. Within it, the SE21 7 sector, the Village and College Road, ran at a £1,600,000 median across 30 sales; SE21 8, the Gallery Road and Dulwich Wood side, ran at £935,000 across 23.
SE22, East Dulwich and the Peckham Rye edge, is the busy one: 384 sales at a median of £710,000. Inside it the spread is real but nothing like SE21’s:
| Sector | Roughly | Median | Sales |
|---|---|---|---|
| SE21 7 | Dulwich Village, College Road and Dulwich Common | £1,600,000 | 30 |
| SE24 9 | The Southwark side of Herne Hill | £1,017,500 | 42 |
| SE21 8 | Gallery Road, Dulwich Wood and the Sydenham Hill edge | £935,000 | 23 |
| SE22 9 | East Dulwich around Lordship Lane and Dog Kennel Hill | £825,000 | 116 |
| SE22 0 | East Dulwich towards Peckham Rye and Barry Road | £725,000 | 149 |
| SE22 8 | East Dulwich towards Goose Green and Peckham Rye station | £595,000 | 119 |
The pattern inside East Dulwich is the hill. Prices are highest at the Lordship Lane and Court Lane end, closest to Dulwich Village, and fall as you walk down towards Goose Green and Peckham Rye station. There is £230,000 between SE22 9 and SE22 8, and they are a fifteen-minute walk apart.
Most of that gap is what is being sold rather than what a given home costs. Across SE22, 200 of the 384 sales were flats at a median of £500,000, against 125 terraced houses at £915,000 and 40 semis at £1,355,000.
Peckham, Camberwell and the north
| Sector | Roughly | Median | Sales |
|---|---|---|---|
| SE1 9 | Bankside, Blackfriars Road and the South Bank | £940,000 | 35 |
| SE15 4 | Peckham Rye, Bellenden and the Rye Lane west side | £787,250 | 104 |
| SE1 8 | Southwark Street, Union Street and the Borough edge | £780,000 | 19 |
| SE1 2 | Bermondsey Street, Tower Bridge Road and Shad Thames | £615,000 | 98 |
| SE1 3 | Long Lane, Tabard Street and the Borough | £560,000 | 81 |
| SE16 6 | Rotherhithe village and the riverside | £542,500 | 48 |
| SE15 2 | Nunhead and the Peckham Rye east side | £540,000 | 103 |
| SE16 5 | Canada Water and Surrey Quays | £525,000 | 57 |
| SE15 3 | Peckham town centre and Queens Road | £520,000 | 135 |
| SE5 8 | Camberwell Grove, Denmark Hill and Camberwell Green | £505,000 | 138 |
| SE1 4 | Elephant and Castle, London Road and St George's | £495,000 | 89 |
| SE17 1 | Walworth Road, Elephant Park and East Street | £481,500 | 88 |
| SE17 3 | Walworth towards Kennington Park and Camberwell New Road | £455,000 | 79 |
| SE16 7 | South Bermondsey and the Blue | £450,000 | 75 |
| SE1 5 | Old Kent Road and Bricklayers Arms | £438,500 | 76 |
| SE5 0 | North Camberwell and the Peckham Road side | £405,000 | 70 |
| SE5 7 | Camberwell towards Kennington and Myatt's Fields | £400,000 | 71 |
| SE16 3 | Bermondsey, Southwark Park Road and Jamaica Road | £396,000 | 79 |
| SE15 6 | Peckham north, Old Kent Road and the Aylesham edge | £385,000 | 68 |
Three things worth pulling out of that table.
Peckham has split in two. SE15 4, the Bellenden and Peckham Rye side, ran at a £787,250 median across 104 sales. SE15 6, the northern end towards the Old Kent Road, ran at £385,000 across 68. That is a gap of £402,250 inside one postcode district, and it is the widest internal split in the borough.
Camberwell is the cheapest large market here. All three of its sectors sit below the borough median, and SE5 7 and SE5 0 at £400,000 and £405,000 are among the lowest in Southwark, despite Camberwell Grove containing some of the finest Georgian terraces in south London. The reason is the same everywhere: those sectors sell flats, and SE5 as a whole sold 230 flats at a £400,000 median against 38 terraces at £878,750.
Street level tells the story better than any average. On addresses with at least eight recorded sales, the dearest in the borough was Grove Park, SE5, at a median of £2,030,000 across ten sales, followed by Croxted Road, SE21, at £1,355,000 across 14. At the other end were Rye Lane, SE15 (£292,500 across eight), Varcoe Road, SE16 (£300,000 across 12) and Old Kent Road, SE1 and SE15 (£309,000 across 17). Grove Park and Camberwell Green are half a mile apart.
Flats and houses: the £420,000 step
| Type | Median | Sales | Share of sales |
|---|---|---|---|
| Detached | £1,800,000 | 29 | 1% |
| Semi-detached | £1,300,000 | 122 | 5% |
| Terraced | £870,000 | 490 | 19% |
| Flat or maisonette | £450,000 | 1,799 | 71% |
The remaining 95 sales are recorded as “other”, a category that mixes converted and commercial property.
The step from a flat to a terraced house in Southwark is £420,000 on these medians, and it is the single largest decision on this page. It is also very uneven by area. In SE22 it is £500,000 to £915,000, a gap of £415,000. In SE5 it is £400,000 to £878,750, a gap of £478,750. In SE21 it is £405,000 to £1,390,000, a gap of £985,000: buying a house rather than a flat in Dulwich Village costs more than three times as much.
New-build barely registers here. Only 34 of the 2,535 sales were new builds, at a median of £534,500 against £520,000 for existing homes, which is a much narrower premium than most London boroughs show.
How Southwark compares
| Area | Average price | Annual change |
|---|---|---|
| Southwark | £578,683 | +0.9% |
| London | £544,814 | -3.7% |
| England | £292,095 | +2.3% |
Southwark is £286,588 above the England average and, unusually for the past year, moving in the opposite direction to London. That does not make it cheap or a bargain. It makes it a borough whose houses are pulling away while its flats stand still.
Frequently asked questions
What is the average house price in Dulwich?
The official index only publishes whole-borough figures, and the average Southwark home sold for £578,683 in May 2026. On completed sales in the year to June 2026, the median in SE21 was £1,370,000 across 53 sales and the median in SE22 was £710,000 across 384. Those are the two Dulwich postcodes, and they are £660,000 apart.
Are Southwark house prices going up or down?
Up, slightly. Prices rose 0.9% in the year to May 2026, against a 3.7% fall across London. The rise is entirely in houses: terraces are up 3.8% and semis 2.8%, while flats are exactly flat at 0.0%.
Which is the cheapest part of Southwark to buy in?
On completed sales, SE15 6, the northern end of Peckham towards the Old Kent Road, at a median of £385,000 across 68 sales, then SE16 3 in Bermondsey at £396,000 and SE5 7 in Camberwell at £400,000. The dearest sector is SE21 7, Dulwich Village, at £1,600,000.
How much is a flat in East Dulwich or Peckham?
On completed sales in the year to June 2026, the median flat was £500,000 in SE22 (East Dulwich), £425,000 in SE15 (Peckham and Nunhead) and £400,000 in SE5 (Camberwell). Across the whole borough it was £450,000.
Why is Dulwich Village so much more expensive than Camberwell?
Mostly what is on the market. SE21 sold 15 terraced houses at a £1,390,000 median and only 13 flats; SE5 sold 230 flats and 38 terraces. Compare house to house and the gap narrows from £925,000 on the headline medians to about £511,000. The rest is the schools, the Picture Gallery, the parks and the private roads, which is also why Dulwich is a market of 53 sales a year rather than 300.
Where can I check what a specific house sold for?
Every completed sale in England and Wales is public. Search a street or address for free on the HM Land Registry Price Paid service.
Related
- Dulwich train times to London: which station you are near sets your fare zone, and in this borough it also tracks the price map closely.
- Southwark planning news: the borough completed 1,004 homes last year against a target of 2,355, which is the supply side of everything above.
- Roadworks, parking and travel in Dulwich: controlled parking hours vary street by street here and affect what a home is worth to a car owner.
Sources
- UK House Price Index, Southwark (ONS and HM Land Registry) for the borough average, property-type and buyer-type figures and the annual changes.
- HM Land Registry UKHPI open data for the May 2026 record, with the London and England benchmarks. The January 2021 peak comes from the same series.
- HM Land Registry Price Paid data for the outcode, sector, street and property-type medians, computed from 2,535 residential sales recorded in the Southwark district completing between 1 July 2025 and 30 June 2026.
- Postcode districts and sectors are described from postcodes.io lookups; where a district straddles a boundary the label describes the Southwark part only.
Land Registry figures are provisional and revised as more sales are registered, and the most recent months in any window are always the thinnest. Confirm the latest numbers against the linked sources before making a decision.
Have your say