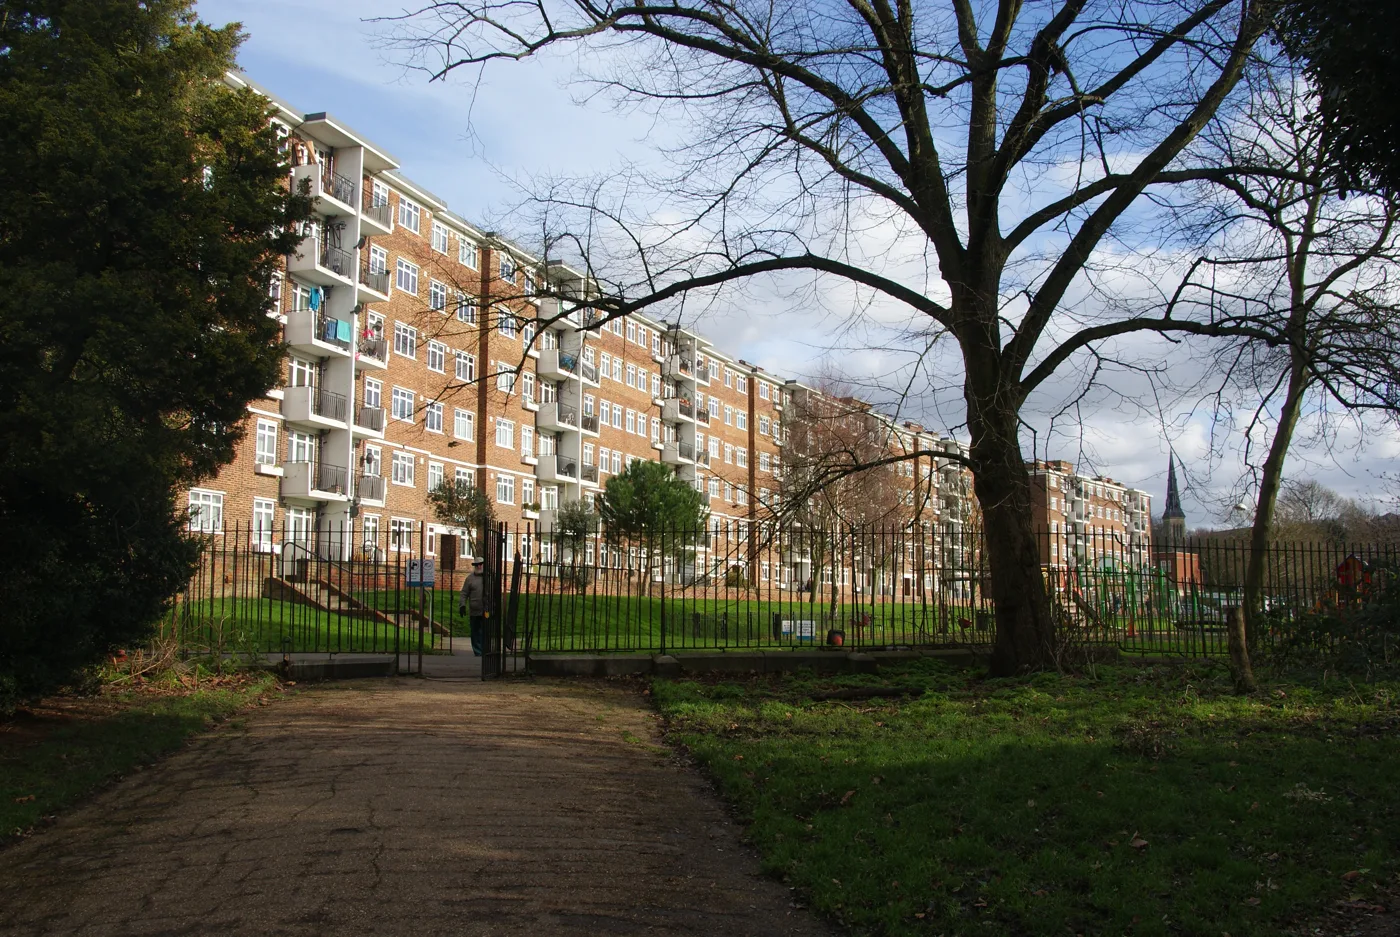

The June Land Registry index puts the average Southwark home at £582,473, up 2.2% in a year while London fell 2.5%. Only 14 of the 33 boroughs rose.
The average home in Southwark sold for £582,473 in June, up 2.2% on a year earlier. Over the same twelve months London as a whole fell 2.5%.
That gap is the story. The figures come from the UK House Price Index published by HM Land Registry and the Office for National Statistics on 19 August, and they cover completed sales, not asking prices.
Southwark’s June figures in full:
- Average price £582,473, up £12,371 on June 2025
- Up 2.2% over the year, and up 0.8% on May
- First-time buyer average £509,989, up 2.2%
- Terraced £849,890, up 3.9%, the strongest of any property type here
- Flats £478,867, up 1.7%
One caveat before any of that is used to price a house. The index average is a mean, not a median, so a handful of very large sales pull it upwards. It also covers the whole borough, which runs from Bankside to the Crystal Palace ridge and contains both £2 million houses off Dulwich Common and £300,000 flats off the Old Kent Road. No street in Southwark is average.
Seventh of thirty-three
Nineteen of London’s 33 boroughs recorded a fall over the year. Fourteen rose, and Southwark was seventh among them.
| Borough | Average price | Change over 12 months |
|---|---|---|
| Barking and Dagenham | £371,030 | +4.3% |
| Havering | £456,759 | +3.9% |
| Redbridge | £495,977 | +3.6% |
| Kingston upon Thames | £594,498 | +2.9% |
| Haringey | £634,444 | +2.5% |
| Waltham Forest | £522,743 | +2.5% |
| Southwark | £582,473 | +2.2% |
| Lewisham | £491,259 | +0.6% |
| Greenwich | £465,132 | -0.5% |
| Bromley | £518,235 | -1.4% |
| Croydon | £394,736 | -1.9% |
| Lambeth | £548,034 | -3.3% |
| City of Westminster | £854,198 | -25.4% |
The boroughs at the top of that list are the cheap ones. Barking and Dagenham, Havering and Redbridge are the three lowest averages of the four risers above Southwark. The falls are concentrated at the expensive end, and they are steep: Westminster down 25.4%, Kensington and Chelsea down 14.7%, Hammersmith and Fulham down 13.3%. Southwark is unusual in being a mid-to-high priced borough that went up.
Two things follow for anyone reading this from a Dulwich, Peckham or Camberwell address. Southwark is now the 14th dearest of the 33 boroughs. And Lambeth, which starts at the far side of Herne Hill and Denmark Hill, fell 3.3%. Homes a few streets apart are on opposite sides of that line.
The flat market held up, and that is unusual
Southwark is a flat market. Most of what changes hands here is a flat or a maisonette, so the borough index is largely a flat index with some very large houses layered on top.
Across London, flats had a bad year. The London flat average fell 4.7% to £431,036. Southwark’s flats went the other way, up 1.7% to £478,867.
The first-time buyer line matters most locally. A first-time buyer in Southwark paid an average of £509,989 in June, up 2.2% on the year. The London first-time buyer average fell 2.8% to £471,629. Getting in here got dearer while getting in elsewhere in London got cheaper.
Where the rise sits in the run of figures
A 2.2% annual rise is the strongest Southwark has recorded since April 2025. It is also a recovery rather than a record. The borough average is still £11,645 below the £594,118 it reached in October 2025.
The recent run:
| Month | Average price | Change over 12 months |
|---|---|---|
| October 2025 | £594,118 | +1.5% |
| January 2026 | £582,054 | 0.0% |
| March 2026 | £569,158 | -2.5% |
| April 2026 | £577,741 | -0.3% |
| May 2026 | £577,665 | +0.7% |
| June 2026 | £582,473 | +2.2% |
Those figures move after publication, and this month they moved in both directions. Last month’s release put May at £578,683 and up 0.9%. In the June file the same month reads £577,665 and up 0.7%, a downward revision of £1,018. April went the other way, revised up from £573,981 to £577,741. Land Registry figures are provisional until enough sales are registered, so a single month read on its own is the least reliable number in the release.
Almost nothing is selling
The price is only half of it. Sales volumes lag the price by about two months, so June and May are still blank, but the numbers that are published are low.
- March 2026: 138 sales in Southwark
- April 2026: 110 sales
Set that against the same months last year, when 610 homes sold in March 2025 and 75 in April 2025. That pair is distorted rather than healthy: the stamp duty threshold changed on 1 April 2025, and buyers piled completions into March to beat it. What the comparison does show is that a normal month in Southwark now runs at around a fifth of that March 2025 spike.
What it means for you
If you are selling. The direction is with you for the first time in a year, and terraced houses are the strongest category at plus 3.9%. But the borough average is still below its October 2025 level, and volumes are thin. A price set against a 2022 comparable will not find a buyer.
If you are buying. Southwark got dearer while most of central and west London got cheaper. If your search can stretch across the boundary, Lambeth fell 3.3% and Lewisham rose only 0.6%, and the boundary runs through Herne Hill, Denmark Hill and Nunhead. It is worth checking which side of it a listing sits on.
If you want the number for your own street. The borough average will not tell you. Individual sold prices are published free on the HM Land Registry Price Paid service, and our own Dulwich house prices page breaks the borough down by postcode district and street from the same records.
Sources
- UK House Price Index for June 2026, HM Land Registry and ONS, published 19 August 2026.
- UK HPI full file, June 2026, the open data release behind that publication, for the Southwark, London, England and borough-by-borough figures and the sales volumes.
- UK HPI full file, May 2026 for the previously published April and May figures, which is how the revisions above were established.
- ONS and HM Land Registry local house price data for Southwark for the borough series.
Related
- Dulwich house prices: area and street medians from Land Registry sold prices, plus the borough index.
- Dulwich planning news: what is being built, and where.
- Dulwich roadworks and travel: what is shut this week.
Have your say